


The Europanel Global E-Commerce Report offers a unique window into the world of online FMCG shopping, spanning 44 countries with insights at the global, regional, and local level.
Explore how online and offline behaviours differ, from Private Label performance to the role of promotions.
See how major categories like Food & Beverage, Personal Care, and Home Care are performing online vs offline.

Understand how online FMCG value and share are evolving globally, complete with regional and local breakdowns driven by real shopping behaviour.
Link the impact and importance of promotions and Private Label online.
Compare and contrast online share of FMCG sectors.


A free annual snapshot of FMCG value trends, with comparisons at global and regional levels. Ideal for a quick overview of economic and category dynamics online.
Our comprehensive annual report goes deeper, tracking both economic and consumer data across key KPIs, individual markets, and time frames. Explore and understand current online FMCG trends at global, regional, and local levels.
|
|
Value | MAT 3 Years |
|---|---|---|
|
|
Penetration | MAT 3 Years |
|
|
Frequency | MAT 3 Years |
|
|
Euro per Trip | MAT 3 Years |
|
|
% Value Change | MAT Dec 2025 vs YA |
|---|---|---|
|
|
Value Share and Share of Occasions | MAT Dec 2025 vs YA |
|
|
Value Share and Penetration | MAT Dec 2025 & MAT 3 Years |
|
|
Frequency and Spend per Trip | MAT Dec 2025 & MAT 3 Years |
|
|
Share | MAT Dec 2025 & MAT 3 Years |
|---|---|---|
|
|
E-Commerce vs Offline Index | MAT Dec 2025 |
|
|
Value Share and Index E-Commerce vs Offline Value Share* | MAT Dec 2025 |
|
|
Penetration | MAT Dec 2025 |
|---|---|---|
|
|
Value Share | MAT Dec 2025 |
|
|
Frequency | MAT Dec 2025 |
|
|
Spend per Trip | MAT Dec 2025 |
|
|
Share | MAT Dec 2025 & MAT 3 Years |
|---|---|---|
|
|
E-Commerce vs Offline Index | MAT Dec 2025 |
|
|
Value Share and Index E-Commerce vs Offline Value Share* | MAT Dec 2025 |
|
|
E-Commerce vs Offline Index | MAT Dec 2025 |
|---|
|
|
E-Commerce vs Offline Index | MAT Dec 2025 |
|---|
|
|
E-Commerce vs Offline Index | MAT Dec 2025 |
|---|
|
|
E-Commerce vs Offline Index | MAT Dec 2025 |
|---|
|
|
Penetration vs Value Share | MAT Dec 2025 |
|---|---|---|
|
|
Penetration & Value Share | MAT 3 Years |
|
|
Basket Size Index vs Share of Trips | MAT Dec 2025 |
|
|
Basket Size Index & Share of Trips | MAT 3 Years |
|
|
Private Label Market E-Commerce and Offline Value Share | MAT Dec 2025 (not included in MEA and North & West Asia) |
|
|
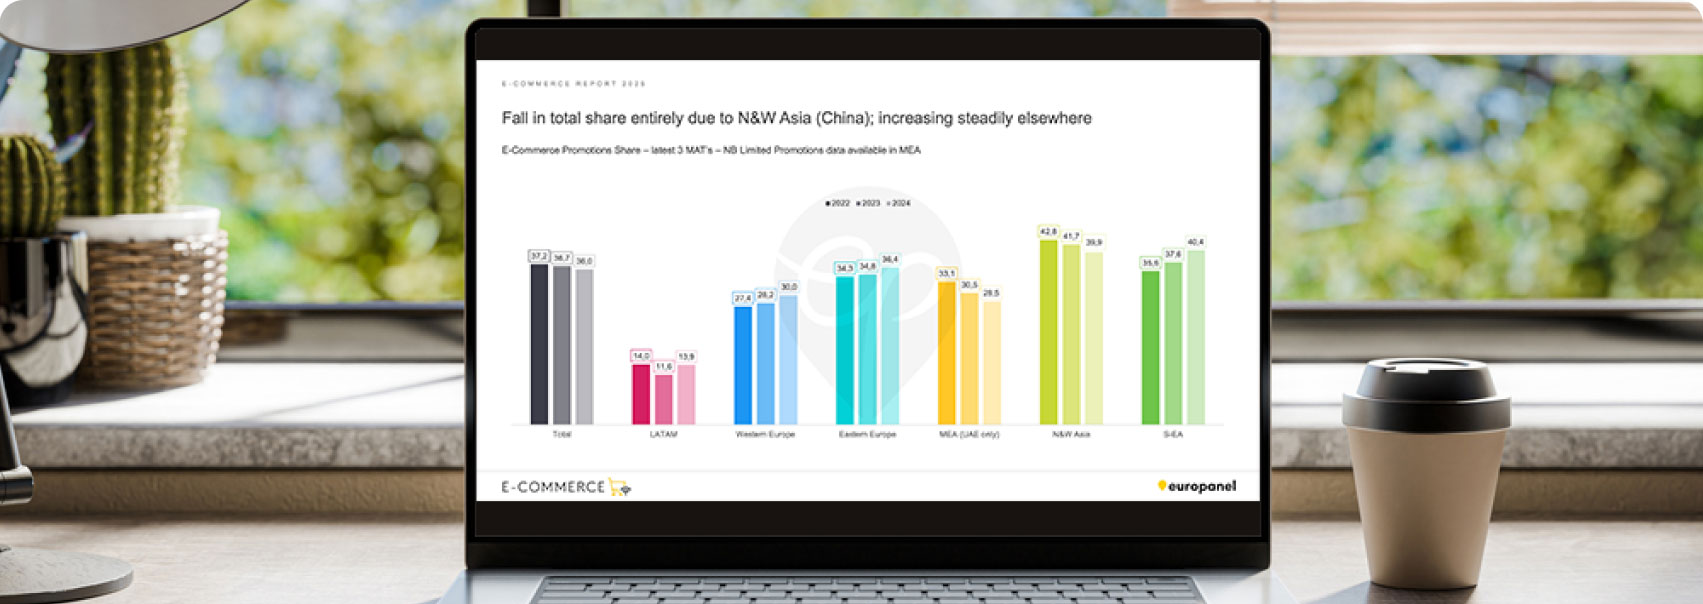
Promotion Market E-Commerce and Offline Value Share | MAT Dec 2025 |
|
|
Frequency vs Spend per Trip | MAT Dec 2025 |
|
|
Frequency & Spend per Trip | MAT 3 Years |
For more information on how to access the insights from this study, please get in touch


